What eBPF stands for
eBPF stands for extended Berkeley Packet Filter, or extended BPF. BPF was first introduced to Linux in 1997 in the tcpdump utility to capture packets for tracing. It then evolved to extended BPF in 2014, with significant extended functionalities, such as changes in the BPF instruction set, the addition of map, and more.
Why eBPF
Historically, to extend Linux kernel’s behaviours, one would either:
- propose changes directly to the Linux kernel, which could take quite some while for community to evaluate and accept; or
- make kernel modules, which can be loaded and unloaded.
In both approaches, safety remains a concern. If the new kernel code is unsafe, it can corrupt the entire kernel.
eBPF brings a new approach to the table by running sand-boxed programs in the kernel that can be dynamically loaded and unloaded at runtime. In other words, it is a safer and more efficient approach to extend kernel functionalities, without the need to restart existing processes.
eBPF improves the extensibility of kernel and spark more innovations at the kernel level. The technology could be used for a variety of applications in observability, tracing, networking, security, and more.
Example: run eBPF program with BCC
In this example, you will run an eBPF program with BCC to see how eBPF can be used to monitor TCP traffic. The example is fairly simple and you will not need to write any eBPF code yourself. This serves a good starting point for subsequent learning and exploration.
So what is BCC? BCC (BPF Compiler Collection) is a toolkit or framework that offers an easy approach to write eBPF programs in Python or Lua. While it is not necessarily the recommended approach to develop eBPF programs for production, it is a low-barrier way to get hands-on and learn about eBPF.
To start, first install BCC on your system.
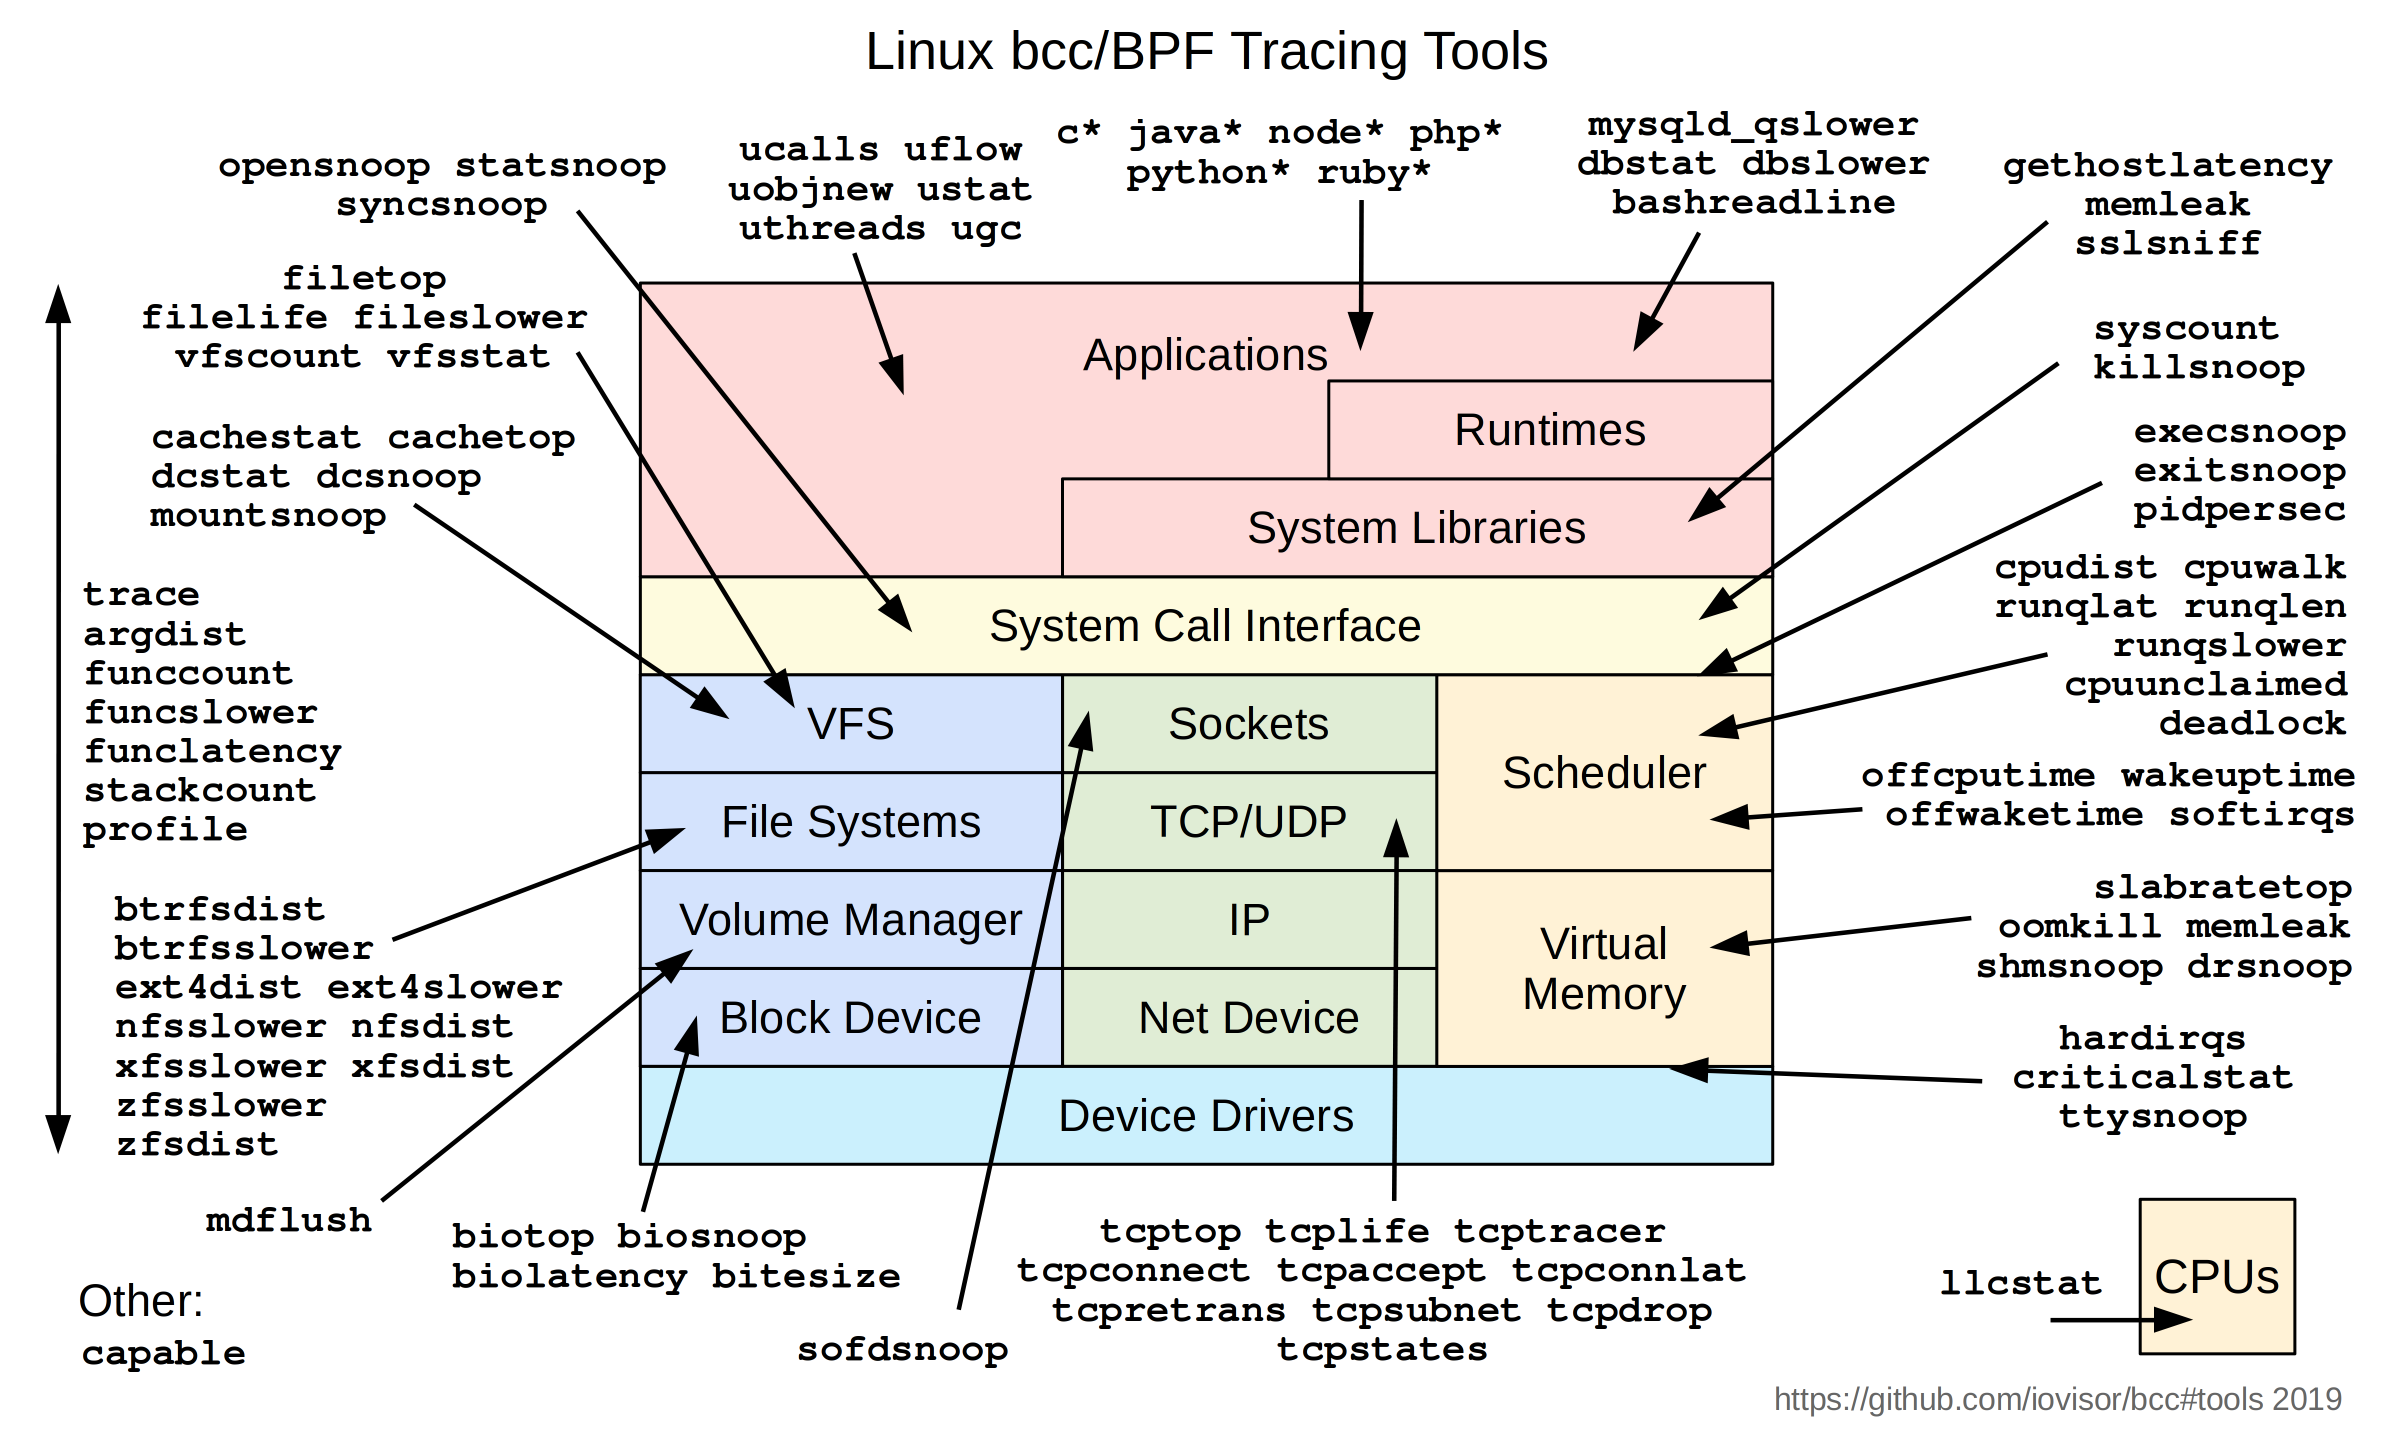
BCC comes with many tools available for use. These tools are installed with -bpfcc extensions. Here’s a diagram for BCC tracing tools:

For this example, run the tcpconnect tool:
tcpconnect-bpfcc # might need sudoYou should see an empty table with the following headers:
PID COMM IP SADDR DADDR DPORTeBPF programs are event-driven. The tcpconnect tool should print one table entry for every active TCP connection, so the next step would be to start some TCP connections.
Open a new terminal and run the following:
curl httpbin.org/get    # HTTP GET request to httpbin.org
ssh 192.168.3.2         # SSH connection to any random IP
In the first terminal where tcpconnect is running, you should see two entries:
PID    COMM         IP SADDR            DADDR            DPORT
11035  curl         4  10.188.0.2       54.83.187.171    80
11043  ssh          4  10.188.0.2       192.168.3.2      22
With this tool, you can look for unexpected connections and improve infrastructure monitoring.
For more example on the tcpconnect tool, see here.
Final Words
eBPF is a large and interesting topic to learn about and this blog only scratches the surface, so here are some more resources.
I found the book Learning eBPF by Liz Rice exceptionally written. Chapters are complemented with examples that are easy to follow. This is a superb resource for developers who want to start programming in eBPF.
The BCC repository mentioned earlier also includes many tools and examples to play with.
Lastly, on the offensive side, there are also DEF CON talks on eBPF, such as Evil eBPF.
Happy exploring!
