
Overview
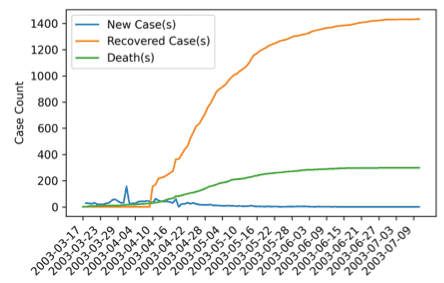
Instead of modelling COVID-19, this project focused on simulating SARS in Hong Kong (2003) due to data availability at the time. One of the curves it simulates is an infection curve - the curve that we all want to flatten.
SARS (Severe Acute Respiratory Syndrome) is a respiratory infectious virus that was first discovered in Guangdong, China in November 2002. It has led to an epidemic in Hong Kong in March 2003, but was fully contained in July of the same year.

The Math
The project simulates the outbreak using a Susceptible-Infected-Removed-Dead (SIRD) model.
Before choosing the SIRD model, the three-compartmental Susceptible-Infected-Removed (SIR) model was considered, in which
- S(t) stands for the number of susceptible individuals at time t
- I(t) stands for the number of infectious individuals at time t
- R(t) stands for the number of recovered individuals at time t
The dynamics between compartments can be described by a set of differential equations:
The sum of the three equations equates to zero, which reiterates the key model assumption that the population count is fixed at all time t - an individual is either susceptible to, infected by, or recovered from the infectious disease.
However, when modelling the SARS cases development in Hong Kong, fatality is a non-negligible driver that affects the rate at which individuals leave the infectious compartment. The case fatality ratio was estimated to be 15% in Hong Kong using the non-parametric competing risk analysis, as disclosed in the consensus document on the epidemiology of SARS by the WHO in November 2003 when the epidemic has fully concluded. This is the main motivation to adopt SIRD model, so that death is considered.
The SIR model can be updated to add a parameter for for death, so the DEs become:
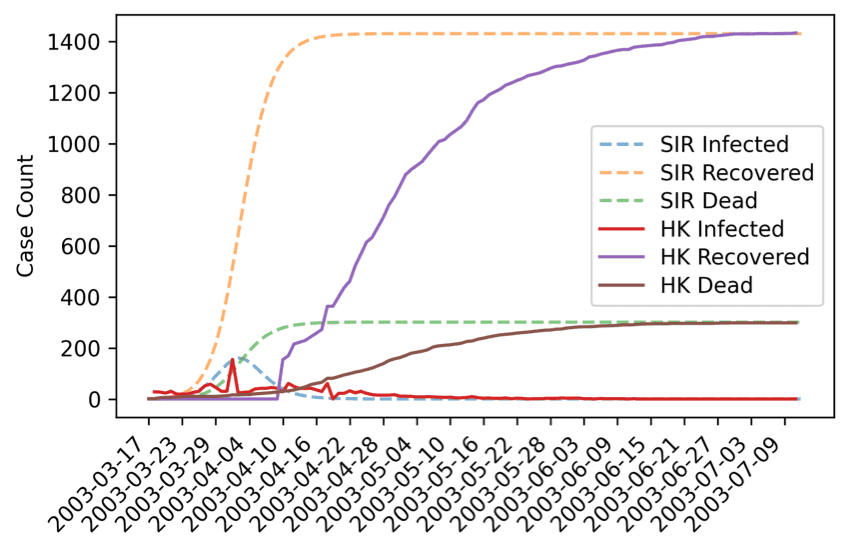
Through iterative parameter tunings and analyses, the simulation was able to describe the peak of the daily infection and the limiting behaviours of the recovered and death relatively well.

To properly model the infection curve, the recovery and death curve rise earlier than the actual data do, not tailoring the collected data well in the early study period. This is expected and can be explained by reporting lags in the actual data.
Conclusion
Although the best-estimated model can simulate similar total infected, recovered, dead case counts, as well as a similar infectious peak in the beginning of April 2003, the model cannot simulate the development more accurately in the early periods due to its simplified assumptions.
Some aspects the model neglects are:
- Virus incubation period
- Time from onset to hospital arrival
- Outbreaks in different phases in different regions (i.e. hospitals, residential estates)
- Effect of mask wearing and quarantine
- Different transmission mechanism (i.e. close-contact transmission vs faecal-droplet transmission from the inadequate plumbing) which may have different infection rates