Tableau visualizations were developed for the qualifying and final round of the Data VizArt Student Challenge (2020) organized by Deloitte, CIBC Data Studio, and Tableau software.
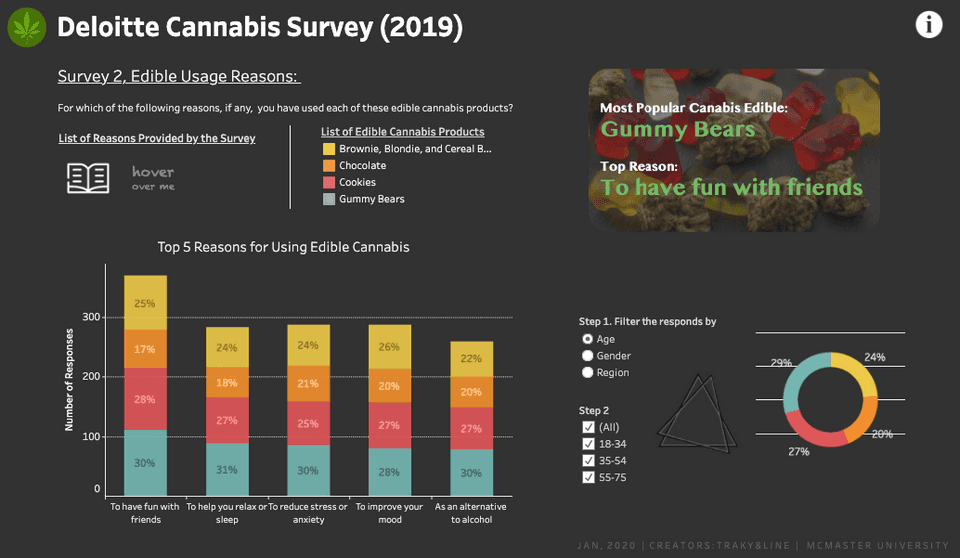
Cannabis & Canada (See Project)
Data Sources: Statistics Canada, Deloitte survey
Topics covered
• Prices and consumption of medical cannabis vs non-medical cannabis
• Age profile, reasons, and frequency of cannabis use
• Production price and consumption price of cannabis in different Canadian provinces
• Preferences in different types of cannabis products
• Cannabis-related crime rate in Canada
Sample Screenshot:

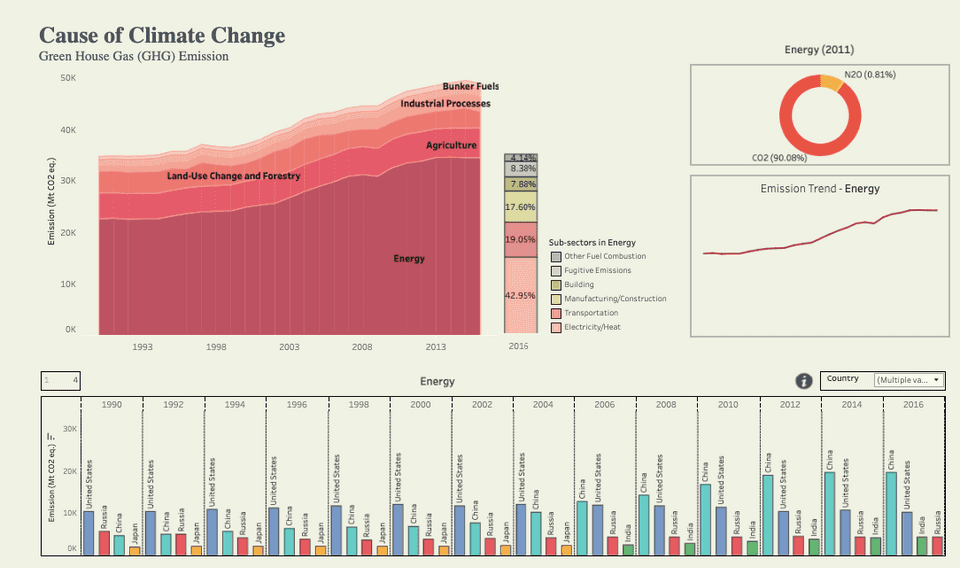
Climate Change and Sustainability (See Project)
Data Sources: Statistics Canada, World Resources Institute, Germanwatch
Topics covered
• Evidence of climate change
• Countries/region and sectors that emit the most greenhouse gases (GHGs)
• Countries/region the most vulnerable to climate change
• Outlook under the Paris Agreement
Sample Screenshot:
